Department & Company Dashboards
This screen gives you an at-a-glance view of your trade performance. Switch between the whole company and individual departments using tabs, and review metrics such as trade volume, ongoing projects, the expected revenue pipeline, and settlements by period.
💡 Who is this for? Executives and department heads who need to understand company-wide trade performance and per-department results. Company-wide metrics are visible only to the company Master, while members see their own department tab.
ℹ️ Visibility conditions — Only the company Master can see the Company tab. If you are not the Master, the Company tab is locked and your own department tab opens instead. Accounts that do not belong to an organization see an "Organization not configured" notice.
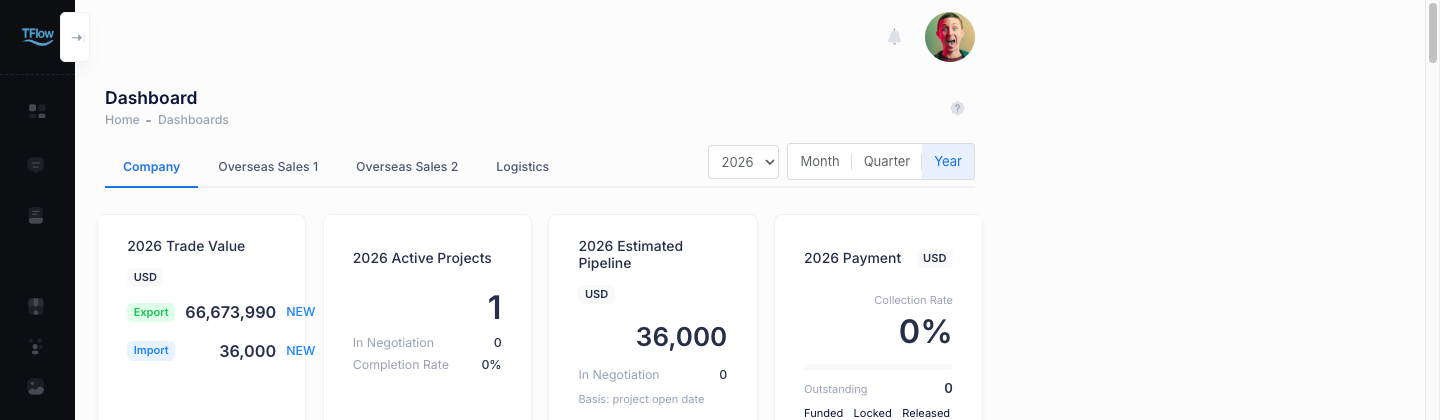
1. Getting In — The Unified Dashboard
Entry: Sidebar Dashboard > Overview → tflowx.com/dashboard
This one screen is where you switch between the Company tab and the department tabs. If you look at one department often, open its tab and bookmark the page so it opens straight away next time.
2. Switching between company and departments
2-1. Tab Bar — Who Sees What
| Your status | Visible tabs |
|---|---|
| Company Master | The Company tab + all Department 1..N tabs |
| Member of a department | Only your own department tab |
| Not in an organization | An "Organization not configured" notice card instead of tabs |
2-2. Period Selection (Right Side)
Choose the lookup period on the right side of the screen. The selected period is shared by the company tab and the department tabs.
- Period toggle: Choose Month / Quarter / Year
- Anchor selector: Look up past periods
- Year: the last 5 years
- Month: January–December
- Quarter: Q1–Q4
3. Company Dashboard (Master only)
If the Company tab is locked or missing — only the company Master can open it. If you need company-wide metrics, ask your company Master. If you have not joined an organization yet, set up your company information in My Profile first.
The Company tab presents company-wide trade performance across several widgets.Visibility conditions
| Section | Contents |
|---|---|
| KPI tiles | Trade volume (export/import + change) · ongoing projects · expected revenue pipeline · settlements |
| Monthly trade volume trend | A combined widget bundling a line chart + donut + table |
| Monthly trade volume by department | Stacked column chart by department |
| Three share donuts by department | Per-department shares of trade / import / export |
| Performance by channel and country | Performance at the channel (partner) and market (country) level |
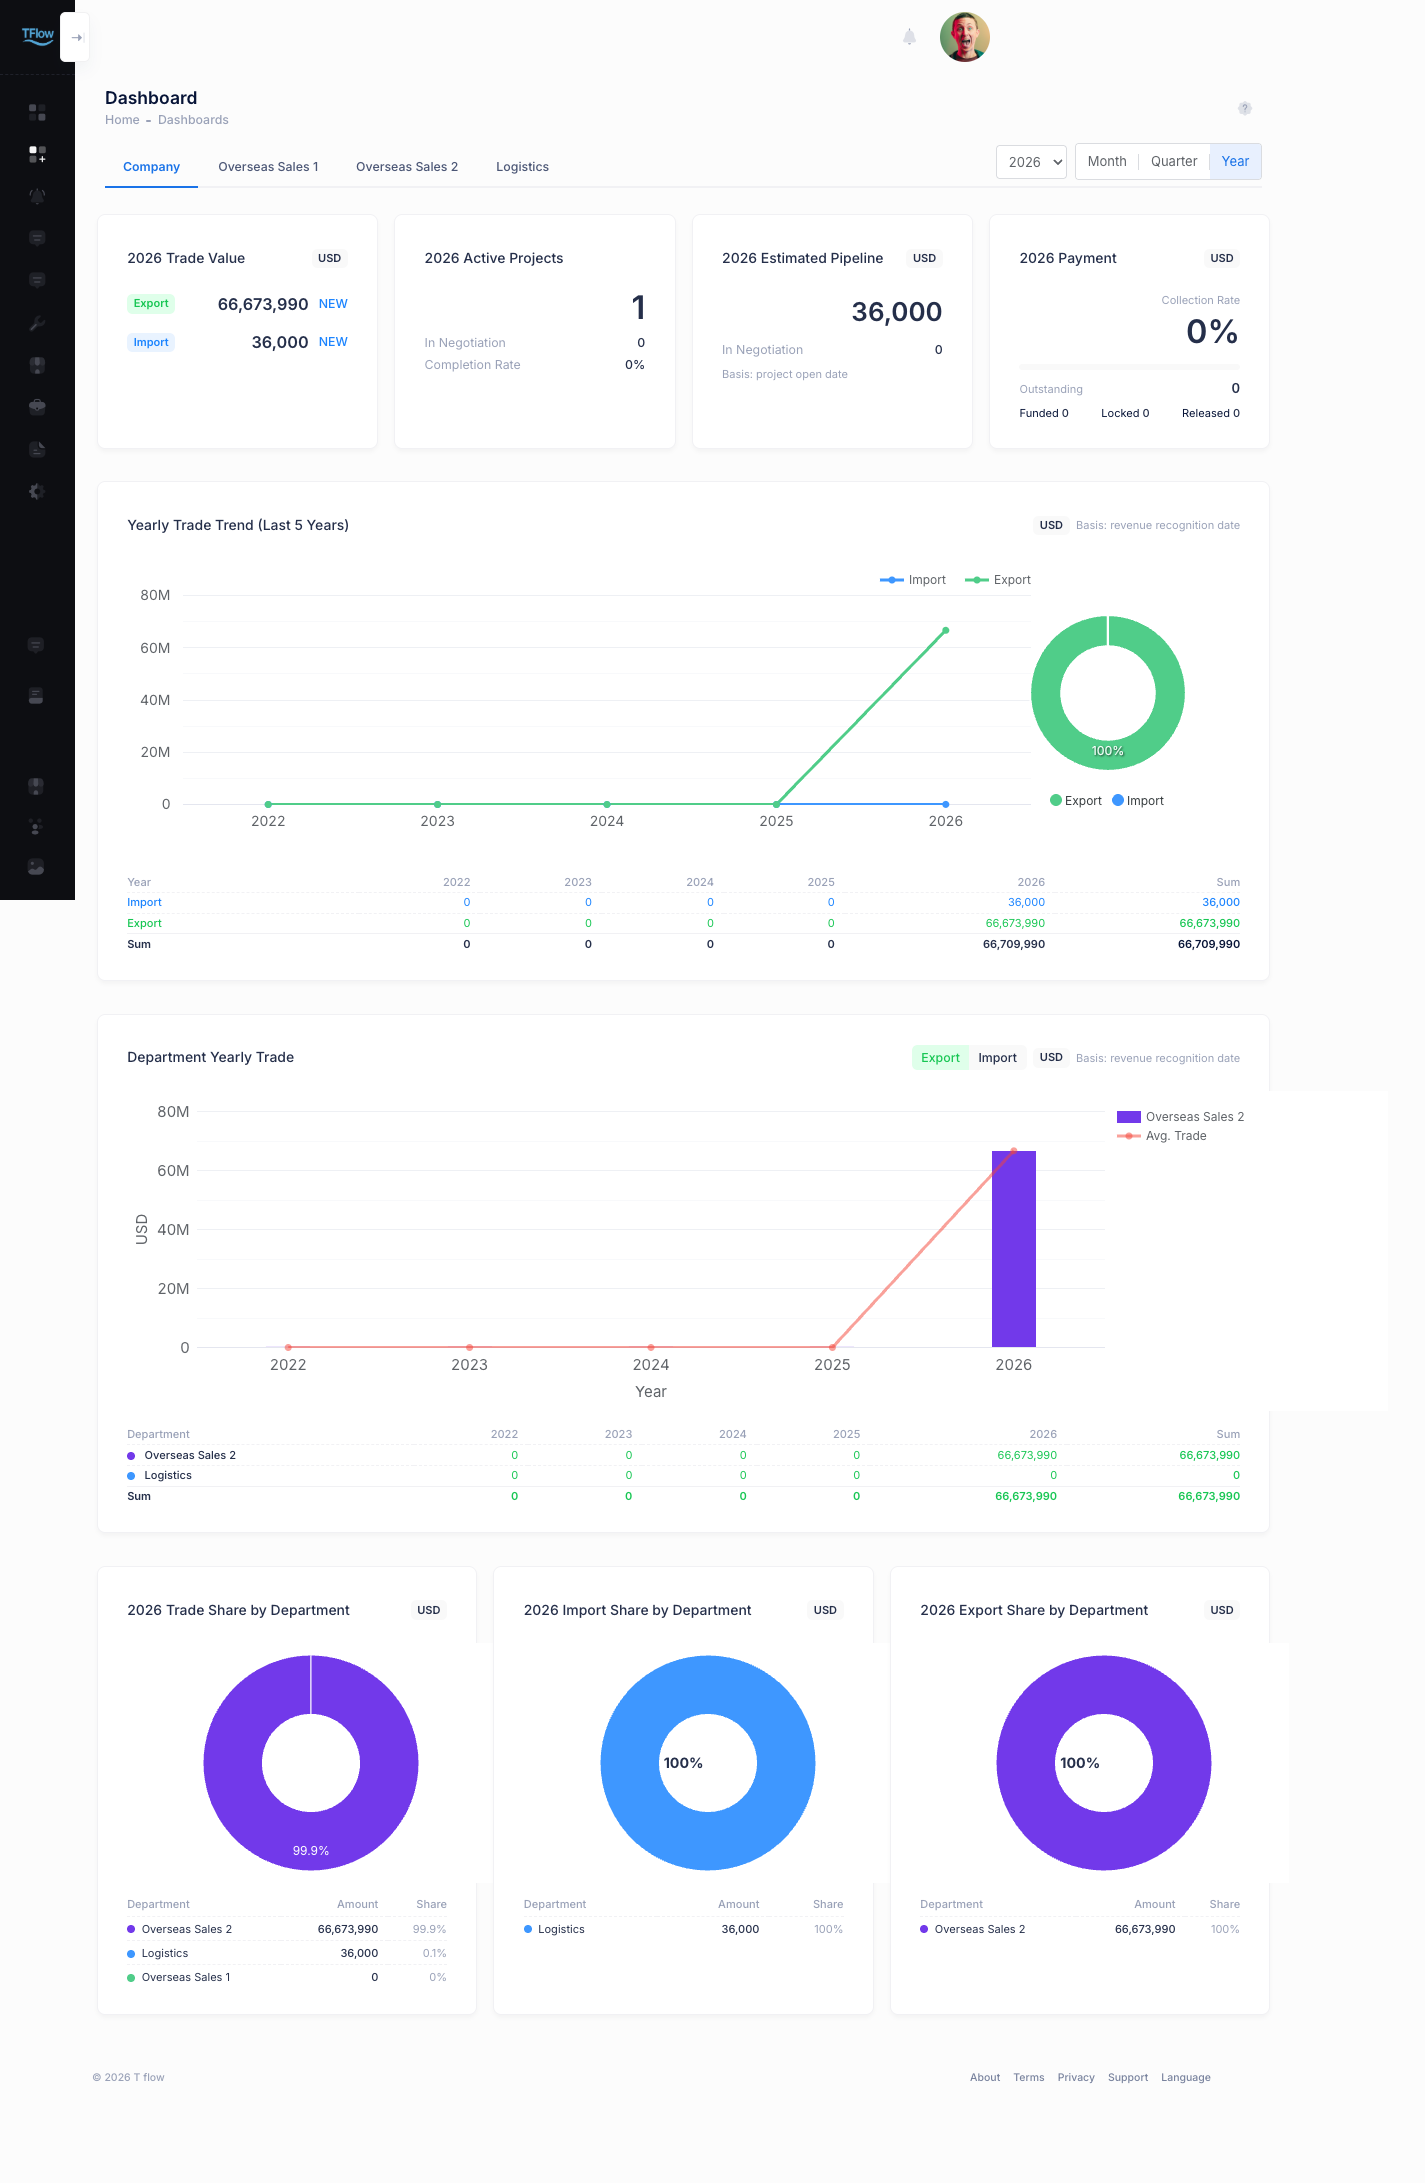
ℹ️ The screen above is set to the Year period. Switching to month or quarter shows only that period's figures, and widgets look empty for periods with no trade.
4. Department Dashboard
If the department tab is empty or won't open — you may not belong to a department yet, or you tried to view a department that isn't yours. Check your department in My Profile > Company info, and if there is none, ask your company Master to assign you one.
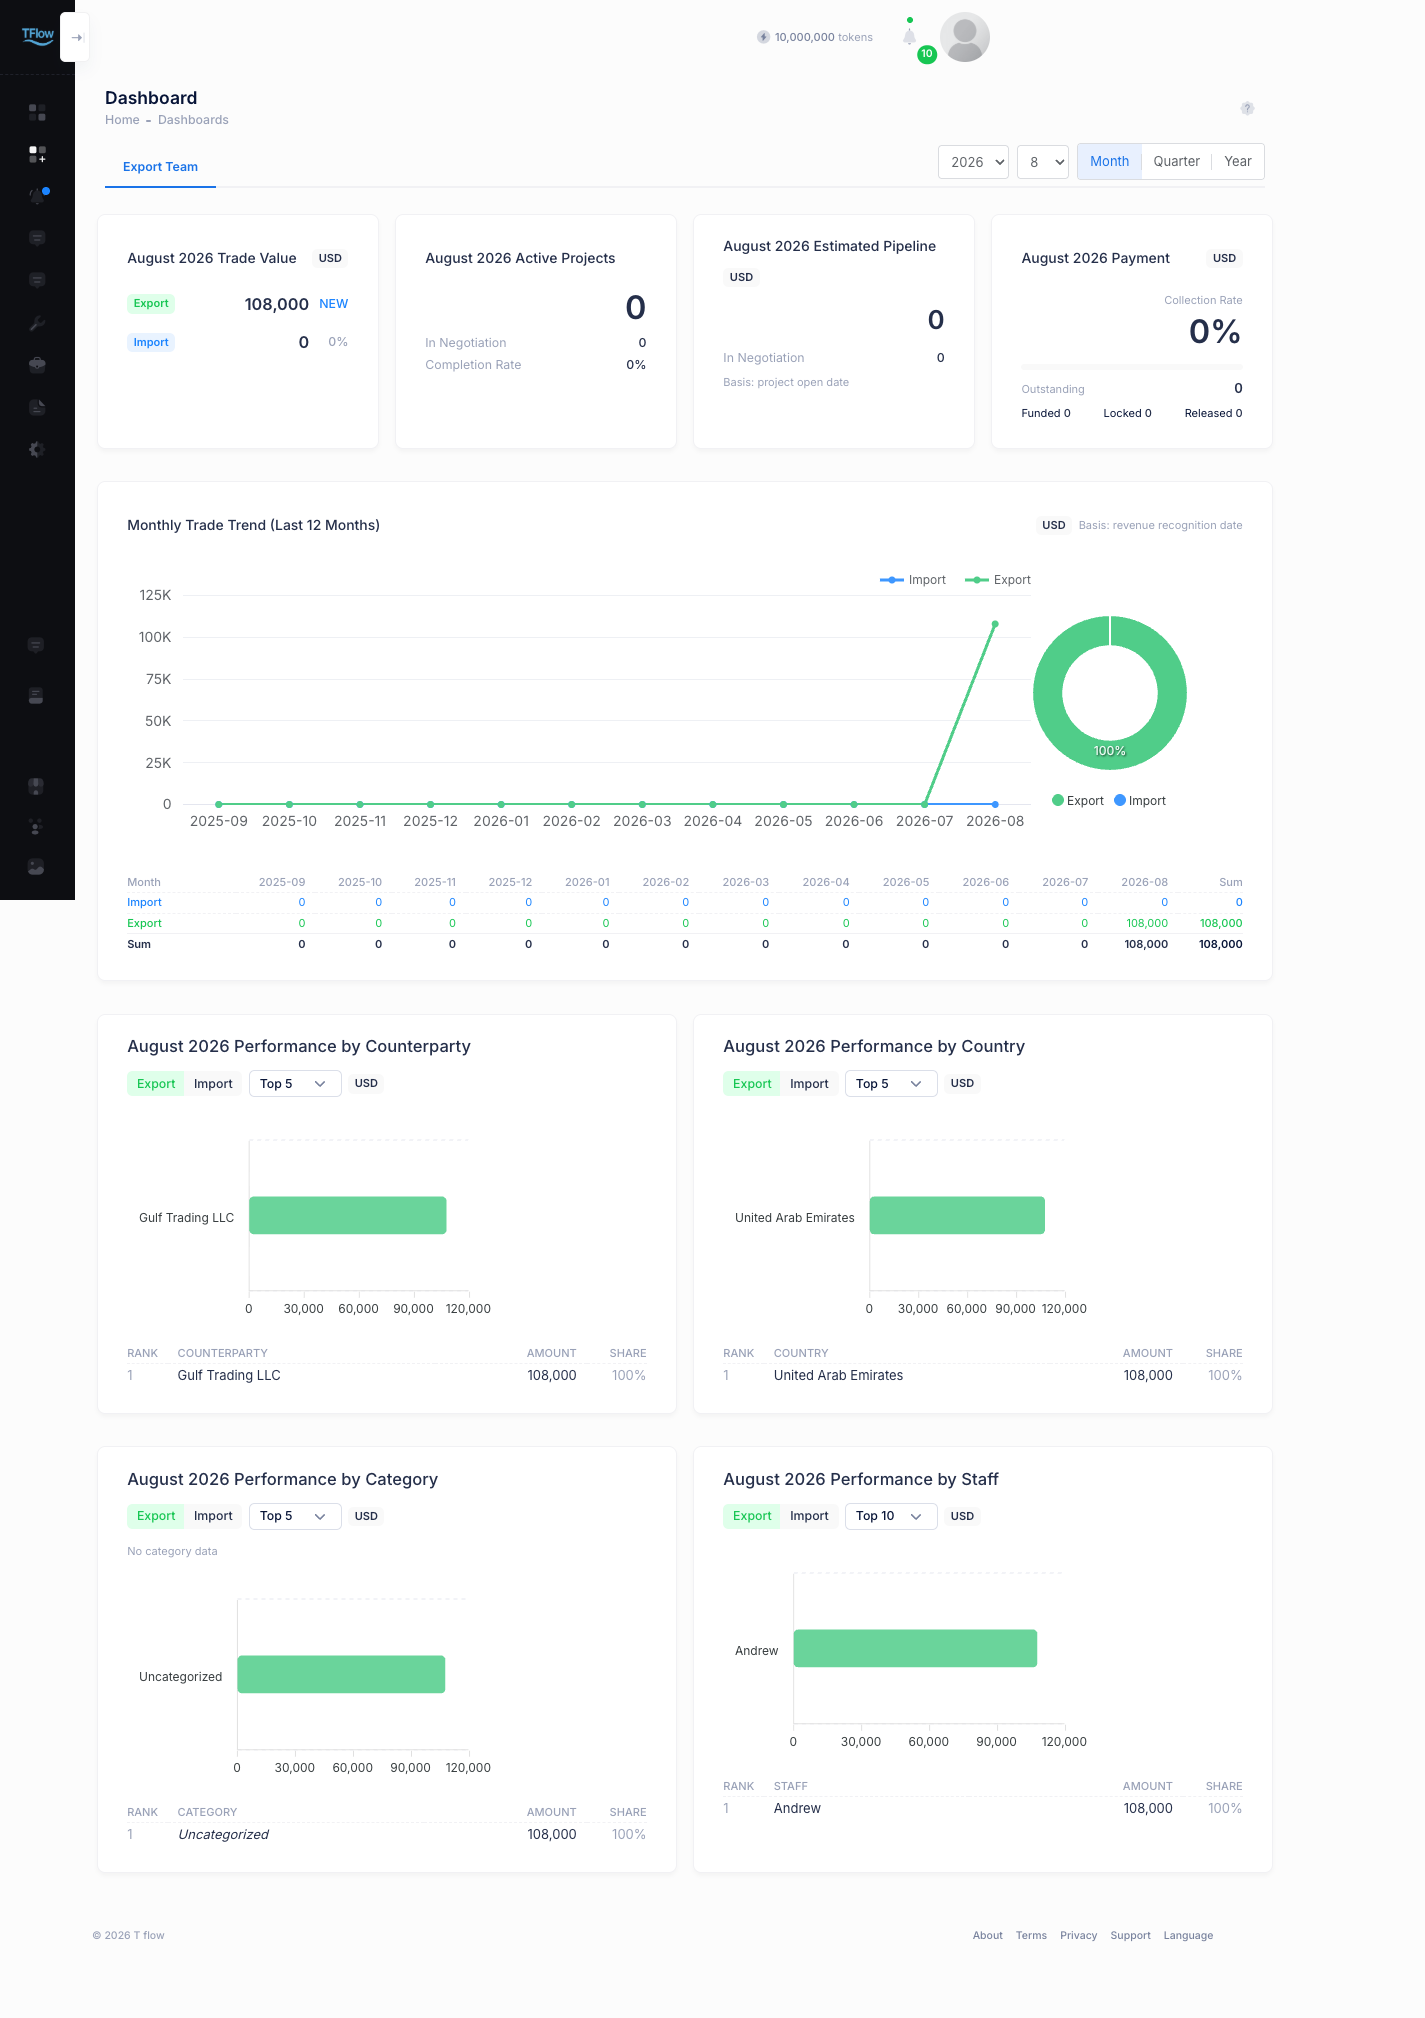
The Department tab shows the performance of the selected department.
| Section | Contents |
|---|---|
| Four KPI tiles | Trade volume · ongoing projects · pipeline · settlements |
| Monthly trade volume trend | The monthly trend for that department |
| Performance | Performance by channel (partner) · market (country) · category · staff |
💡 Troubleshooting (FAQ)
Q. I can't see the Company tab, or it's locked. A. The Company tab is for the company Master only.Visibility conditions If you are not the Master, you can only see your own department tab. If you need company-wide metrics, ask your company Master.
Q. I only see the "Organization not configured" notice. A. Your account has not yet joined an organization (company). Set up your company information in My Profile, or ask your company Master to add you to the organization.
Q. I want to see last month's or last year's performance. A. Use the period toggle on the right to choose month/quarter/year, then use the anchor selector to pick the past period you want (year: last 5 years, month: 1–12, quarter: 1–4). The selected period applies to both the company and department tabs.
Q. I want to open a specific department's screen directly. A. Click that department's tab in the tab bar. If you look at it often, bookmark the page so it opens straight away next time.
Q. I want a closer look at the settlement (payment) flow. A. You can review escrow/settlement status, amounts, and recent cases in the dedicated XRPL Settlement Dashboard.